Bridging Ethereum (ETH) to the Base chain has become one of the fastest-growing on-chain moves for traders, DeFi power users, and memecoin hunters in 2025. With Ethereum priced at $3,394.43 as of November 12,2025, and Base chain’s ecosystem booming thanks to Coinbase’s backing, understanding how to bridge your assets efficiently is more important than ever. This isn’t just about saving on gas fees or chasing airdrops – it’s about unlocking a new layer of speed and scalability for your ETH.

Why Bridge to Base Chain in 2025?
If you’ve been tracking the explosive growth of Layer 2s, you know that Base stands out for its low fees, fast finality, and deep integration with Coinbase. Whether you’re looking to farm new memecoins, deploy capital into yield protocols, or just move ETH cheaply, bridging is your entry point. The current market data shows ETH hovering at $3,394.43, making cost efficiency even more crucial when moving larger sums.
The process has never been easier or safer – with audited bridges like deBridge, Rhino. fi, and Across Protocol offering near-instant transfers and competitive rates. But not all bridges are created equal: some offer lower fixed fees (like deBridge’s 0.001 ETH per transfer), while others aggregate routes for optimal pricing.
Step-by-Step Guide: Moving ETH from Ethereum Mainnet to Base
Bridge ETH from Ethereum to Base with MetaMask or Coinbase Wallet (2025 Edition)

– Network Name: Base
– RPC URL: https://mainnet.base.org
– Chain ID: 8453
– Currency Symbol: ETH
– Block Explorer URL: https://basescan.org
This step ensures your wallet can interact with the Base chain!


Let’s break down the process so you can get your ETH onto Base without headaches:
- Set Up Your Wallet: Make sure you’re using a compatible wallet like MetaMask or Coinbase Wallet. Add the Base network manually with these settings:
- Network Name: Base
- RPC URL: https://mainnet.base.org
- Chain ID: 8453
- Currency Symbol: ETH
- Block Explorer URL: https://basescan.org
- Select Your Bridging Platform: Top choices in 2025 include deBridge (speedy and secure), Rhino. fi (aggregated routing), and Across Protocol (user-friendly UI). Each platform supports direct bridging from Ethereum to Base.
- Connect and Initiate Bridge: Head to the platform’s website, connect your wallet, select Ethereum as your source chain and Base as destination. Choose ETH as your asset and enter the amount.
- Approve and Confirm: Review gas fees carefully – they fluctuate based on network demand but are typically much lower than L1 swaps. Approve in your wallet and confirm the transaction.
- Switch Networks and Verify Receipt: Once complete (usually within minutes), switch MetaMask/Coinbase Wallet over to the Base network. Check your new balance – congrats! You’re now live on one of crypto’s hottest L2s.
If you want even more visuals or step-by-step screenshots for this process, check out our comprehensive guide here: How to Bridge Ethereum to Base Chain: Step-by-Step Guide for 2025.
The Cost Factor: Comparing Bridge Fees and Speed in Real Time
No one likes surprises when it comes to fees or wait times. In 2025, bridge competition is fierce – but that means better deals for users. For example:
- deBridge: Fixed fee of 0.001 ETH per transfer plus gas fees
- Aggressive aggregators like Rhino. fi: Route swaps for lowest total cost across over 35 chains
- User-friendly options like Across Protocol: Prioritize speed with secure settlement mechanisms
If you’re bridging during peak hours or moving large sums at today’s price of $3,394.43 per ETH, watch both base fee estimates and slippage closely.
Cryptocurrency Price Comparison: Ethereum, Bitcoin, Stablecoins & Layer 2s (2025)
6-Month Price Performance for Major Assets Relevant to Bridging ETH to Base Chain
| Asset | Current Price | 6 Months Ago | Price Change |
|---|---|---|---|
| Ethereum (ETH) | $3,398.80 | $3,200.00 | +6.2% |
| Bitcoin (BTC) | $101,728.00 | $95,000.00 | +7.1% |
| Tether (USDT) | $1.00 | $1.00 | +0.0% |
| USD Coin (USDC) | $1.00 | $1.00 | +0.0% |
| Base Protocol (BASE) | $0.2605 | $0.2500 | +4.2% |
| Arbitrum (ARB) | $0.2625 | $0.2400 | +9.4% |
| Optimism (OP) | $0.4017 | $0.3800 | +5.7% |
| Polygon (MATIC) | $1.20 | $1.10 | +9.1% |
Analysis Summary
Over the past six months, Ethereum (ETH) has grown by 6.2%, reflecting moderate market optimism. Bitcoin (BTC) saw a similar positive trend with a 7.1% increase. Stablecoins like USDT and USDC maintained their $1.00 peg. Layer 2 and scalability-focused assets such as Base Protocol, Arbitrum, Optimism, and Polygon all posted gains, with Arbitrum and Polygon leading the group.
Key Insights
- Ethereum (ETH) and Bitcoin (BTC) both experienced steady growth, with ETH up 6.2% and BTC up 7.1%.
- Stablecoins (USDT, USDC) remained stable at $1.00, showing no volatility over the period.
- Layer 2 solutions and related assets (Base Protocol, Arbitrum, Optimism, Polygon) all posted positive returns, highlighting increased market interest in Ethereum scalability.
- Arbitrum (ARB) and Polygon (MATIC) outperformed other Layer 2 assets with 9.4% and 9.1% gains, respectively.
All prices and percentage changes are sourced directly from the provided real-time market data as of November 12, 2025. The comparison uses exact figures for current and 6-month historical prices, ensuring accuracy and consistency.
Data Sources:
- Main Asset: https://www.coingecko.com/en/coins/ethereum
- Bitcoin: https://www.coingecko.com/en/coins/bitcoin
- Tether: https://www.coingecko.com/en/coins/tether
- USD Coin: https://www.coingecko.com/en/coins/usd-coin
- Base Protocol: https://www.coingecko.com/en/coins/base-protocol
- Arbitrum: https://www.coingecko.com/en/coins/arbitrum
- Optimism: https://www.coingecko.com/en/coins/optimism
- Polygon: https://www.coingecko.com/en/coins/polygon
Disclaimer: Cryptocurrency prices are highly volatile and subject to market fluctuations. The data presented is for informational purposes only and should not be considered as investment advice. Always do your own research before making investment decisions.
Ethereum (ETH) Price Prediction 2026-2031
Comprehensive Outlook Based on Market Trends, Adoption, and Technical Analysis (Baseline: $3,394.43 as of Nov 2025)
| Year | Minimum Price | Average Price | Maximum Price | Potential YoY % Change (Avg) | Market Scenario Insights |
|---|---|---|---|---|---|
| 2026 | $2,800 | $3,700 | $4,600 | +9% | Ethereum consolidates gains as Layer 2 adoption (including Base) increases, but potential market corrections expected. |
| 2027 | $3,100 | $4,400 | $5,800 | +19% | Growth in DeFi and cross-chain interoperability boosts demand. Regulatory clarity in major markets drives cautious optimism. |
| 2028 | $3,600 | $5,300 | $7,000 | +20% | Major upgrades (e.g., Ethereum scaling, ZK tech) unlock new use cases. Institutional adoption grows, but competition from other L1s persists. |
| 2029 | $4,100 | $6,200 | $8,500 | +17% | Continued mainstream integration and improved scalability. Macro environment (interest rates, global regulation) impacts volatility. |
| 2030 | $4,600 | $7,100 | $10,000 | +15% | ETH cements role as primary settlement layer for tokenized assets. Bullish scenario prices in increased utility; bearish scenario reflects tech disruption risk. |
| 2031 | $5,000 | $8,200 | $12,000 | +15% | Long-term use cases in RWAs, NFTs, and gaming expand. Potential for a new market cycle, but regulatory and competitive risks remain. |
Price Prediction Summary
Ethereum is expected to experience steady growth from 2026 to 2031, driven by increased adoption of Layer 2 solutions like Base, ongoing protocol upgrades, and expanding real-world use cases. While volatility and market corrections are likely, the overall trend is bullish, especially in scenarios of continued technology leadership and favorable regulation. Maximum price scenarios reflect periods of strong market sentiment and innovation, while minimum prices account for potential downturns or increased competition.
Key Factors Affecting Ethereum Price
- Adoption of Layer 2 solutions (including Base) for scalability and low fees
- Regulatory clarity and global policy shifts impacting crypto markets
- Major Ethereum upgrades (scalability, security, ZK rollups)
- Growth in DeFi, NFTs, and real-world asset tokenization
- Macro-economic environment (interest rates, global growth, risk appetite)
- Competition from other smart contract platforms (Solana, Avalanche, etc.)
- Security and reliability of cross-chain bridges and protocols
Disclaimer: Cryptocurrency price predictions are speculative and based on current market analysis.
Actual prices may vary significantly due to market volatility, regulatory changes, and other factors.
Always do your own research before making investment decisions.
Ethereum Technical Analysis Chart
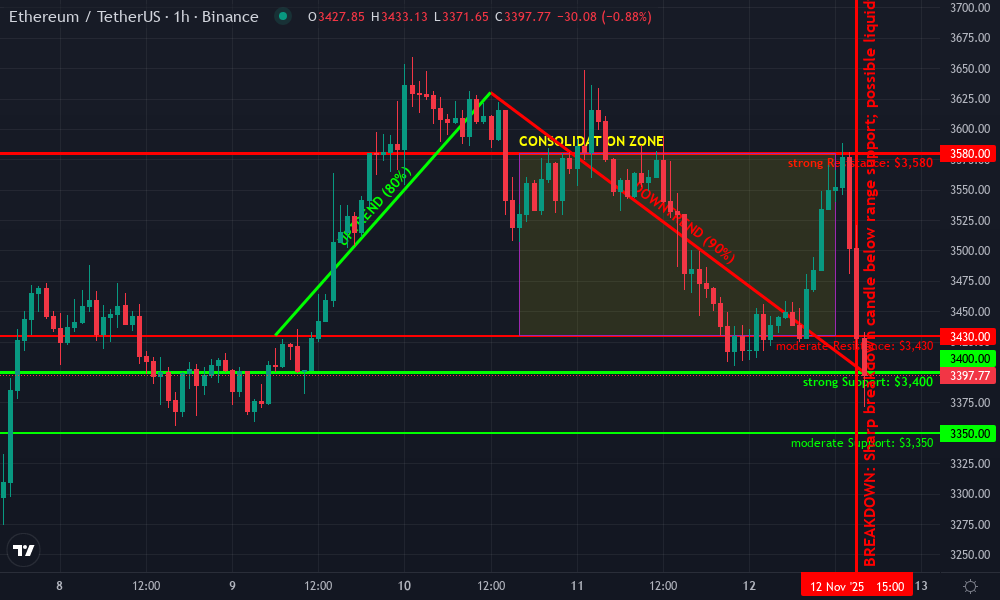
Analysis by Marcus Sheldon | Symbol: BINANCE:ETHUSDT | Interval: 1h | Drawings: 8
Technical Analysis Summary
Start by plotting a major horizontal support line at $3,400, which is the current price and also where price just wicked below before a quick recovery. Draw a resistance line at $3,580, marking the recent swing high. Use trend lines to capture the short-term uptrend from Nov 9 to the peak on Nov 10 ($3,430 to $3,630), and then a downtrend from that peak to the current price ($3,630 to $3,400). Draw a rectangle to highlight the consolidation range between $3,430 and $3,580 from Nov 10 to Nov 12. Use vertical lines to mark the clear breakout on Nov 10 and the breakdown candle on Nov 12. For aggressive entries, use long/short position tools around the support and resistance, with tight stops just outside the range. Add callouts at the failed rally and sharp breakdown for commentary.
Risk Assessment: high
Analysis: Extreme volatility into major support, with potential for rapid reversals or continued breakdown. Aggressive traders can exploit fake-outs, but risk of whipsaw is elevated.
Marcus Sheldon’s Recommendation: Play the extremes: scalp the $3,400 level for quick bounces, but cut losses fast if price closes below. If $3,430 is reclaimed with momentum, flip bias to long for a squeeze back toward $3,580. Stay nimble, size small, and embrace the chaos—this environment is tailor-made for aggressive, high-risk tactical trades.
Key Support & Resistance Levels
📈 Support Levels:
-
$3,400 – Key round-number support; current price; tested by recent wick.
strong -
$3,350 – Prior low; potential next downside target if $3,400 fails.
moderate
📉 Resistance Levels:
-
$3,430 – First local resistance; prior range floor.
moderate -
$3,580 – Major range top and recent swing high.
strong
Trading Zones (high risk tolerance)
🎯 Entry Zones:
-
$3,400 – Potential bear trap/reversal zone at strong support; aggressive long entry if reclaimed.
high risk -
$3,430 – Breakout retest; possible momentum long if flipped.
medium risk
🚪 Exit Zones:
-
$3,350 – Profit target for shorts if $3,400 breaks down.
💰 profit target -
$3,435 – Stop-loss for aggressive longs below reclaim.
🛡️ stop loss -
$3,580 – Profit target for aggressive reversal longs.
💰 profit target
Technical Indicators Analysis
📊 Volume Analysis:
Pattern: Volume spike on breakdown candle likely (not shown, but implied by price action).
Watch for above-average volume confirming the breakdown or indicating a reversal. Use callout to annotate volume spike if visible.
📈 MACD Analysis:
Signal: Bearish crossover likely given sharp move down.
Momentum has shifted bearish, but watch for quick MACD reversal if price springs up from $3,400.
Applied TradingView Drawing Utilities
This chart analysis utilizes the following professional drawing tools:
Disclaimer: This technical analysis by Marcus Sheldon is for educational purposes only and should not be considered as financial advice.
Trading involves risk, and you should always do your own research before making investment decisions.
Past performance does not guarantee future results. The analysis reflects the author’s personal methodology and risk tolerance (high).
The bottom line? Shop around before hitting confirm – small differences in bridge fees can add up fast when dealing with high-value assets at current market prices.
After your ETH lands on Base, you’re ready to tap into one of the fastest-evolving Layer 2 ecosystems out there. Whether you’re a memecoin sniper or a DeFi yield optimizer, having funds on Base opens doors to exclusive launches, lower gas costs, and instant settlement. Remember: every bridge has its quirks and strengths. If you’re bridging more than once or with larger sums (think $3,394.43 per ETH), those tiny fee differences can mean hundreds of dollars over time.

Security and Best Practices for Bridging in 2025
Let’s talk risk management. Even with audited bridges and battle-tested protocols, cross-chain transfers remain a prime target for exploits. Here’s how to keep your assets safe while bridging:
- Use only official bridge URLs – bookmark the real sites and double-check before connecting your wallet.
- Test with small amounts first – especially on new platforms or during network congestion.
- Monitor gas fees – if they spike above normal levels (relative to the current $3,394.43 ETH price), consider waiting.
- Avoid phishing links shared in unofficial Telegrams, Discords, or Twitter threads.
If you want more hands-on guidance or user stories about bridging safely, check out our detailed breakdown at How to Bridge to Base: A Step-by-Step Guide with Real User Experiences and Visuals.
What Happens After You Bridge? Next Steps on Base
Your ETH is now live on Base, so what’s next? Here are some high-impact moves:
- Explore new DeFi protocols: Many projects launch exclusively on Base first for lower fees and faster transactions.
- Dive into memecoins: The hottest meme projects are dropping daily, just remember that volatility cuts both ways!
- Airdrop hunting: Some protocols reward early bridgers with juicy retroactive airdrops, track eligibility windows closely.
- NFT minting: Mint NFTs at a fraction of L1 prices thanks to Base’s optimized infrastructure.
The best part? You can always bridge back to Ethereum if needed using the same platforms, just reverse the process.
Final Thoughts: Why Efficiency Matters as ETH Sits at $3,394.43
The migration of liquidity from Ethereum mainnet to Layer 2s like Base isn’t slowing down, in fact, it’s accelerating as more traders chase speed and cost savings. With ETH holding strong at $3,394.43, every basis point saved in fees is another win for your bottom line. My advice? Stay nimble, double-check security steps, and keep an eye on new bridge integrations as competition heats up even further through Q4 2025.
If you need more granular walkthroughs or want real-time updates on bridging strategies as market conditions shift, bookmark our evolving resource here: How to Bridge Ethereum to Base Chain: Step-by-Step Guide for 2025.